Understanding unimodal vs bimodal distributions is essential when working with data. These terms describe how values are spread and where the most frequent values appear.
In simple words, they help you understand the “shape” of your data.
In Statistics, recognizing patterns like Unimodal Distribution and Bimodal Distribution allows better decision-making and interpretation.
If you’re a student or a data enthusiast, this guide will make everything clear and easy to understand.
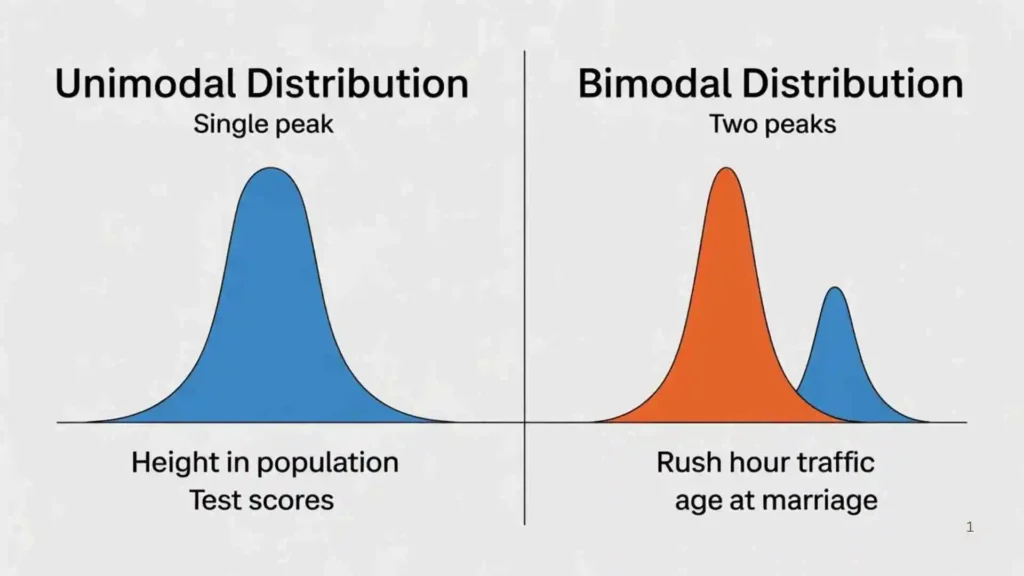
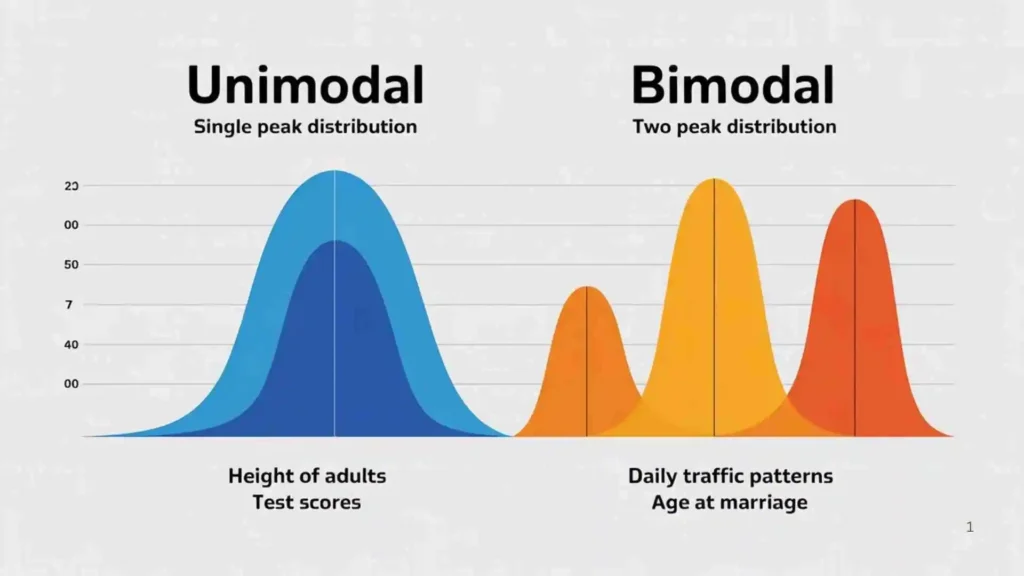
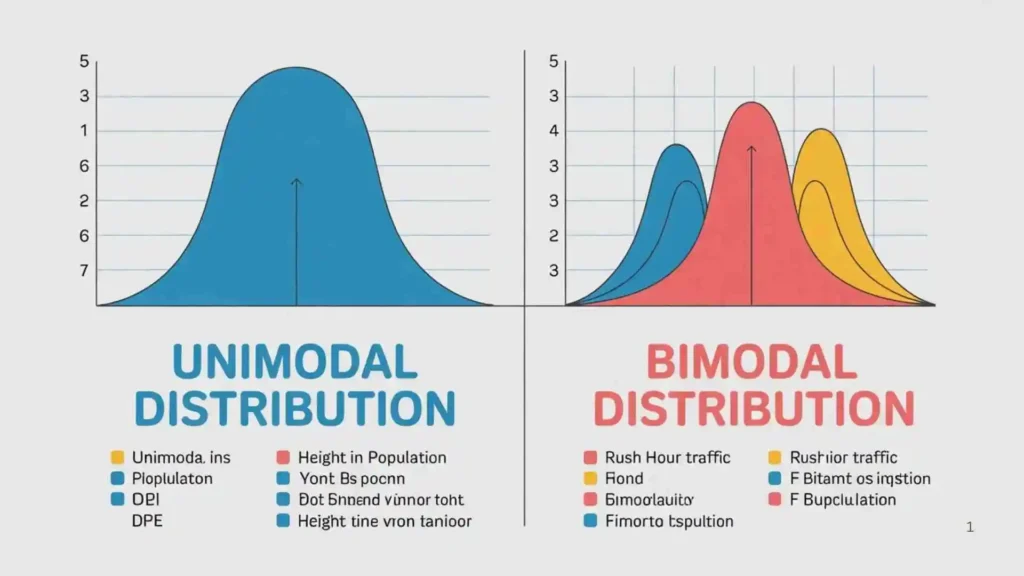
What Is a Unimodal Distribution?

A unimodal distribution has one clear peak (mode).
Key Features:
- Single most frequent value
- Smooth and simple shape
- Easy to interpret
Example:
Test scores where most students score around the same range.
What Is a Bimodal Distribution?
A bimodal distribution has two distinct peaks.
Key Features:
- Two most frequent values
- Indicates two groups in data
- More complex shape
Example:
Heights of men and women combined in one dataset.
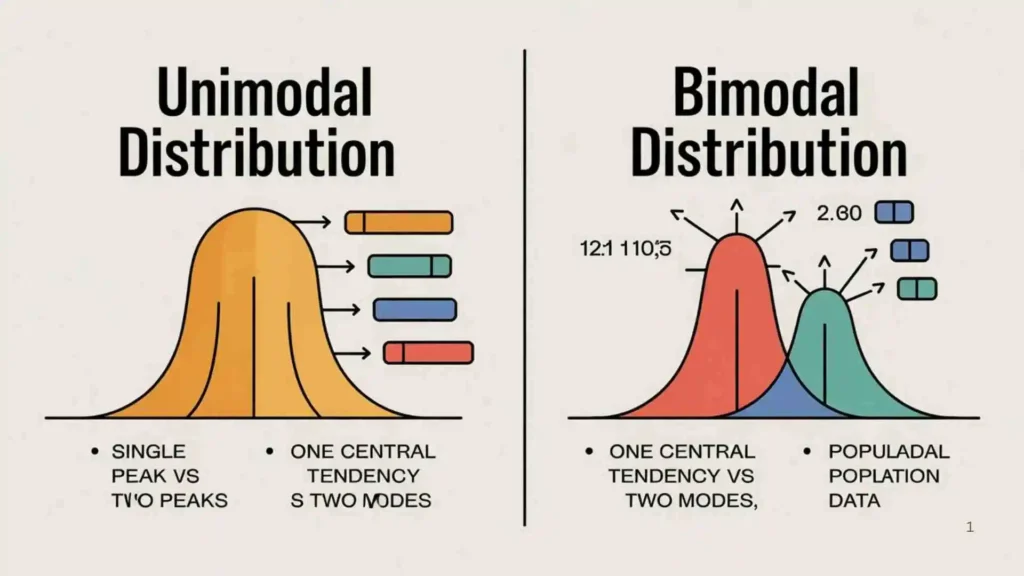
Unimodal vs Bimodal: Key Differences Explained
Number of Peaks
- Unimodal: One peak
- Bimodal: Two peaks
Data Interpretation
- Unimodal: One dominant trend
- Bimodal: Two different patterns or groups
Graph Shape
- Unimodal: Bell-shaped or single curve
- Bimodal: Two separate humps
Use Cases
- Unimodal: Simple datasets
- Bimodal: Mixed or grouped data
Real-Life Examples of Unimodal and Bimodal Data
Unimodal Examples
- Exam scores
- Daily temperatures
- Average income in a small town
Bimodal Examples
- Male vs female height
- Morning vs evening traffic
- Product demand in two seasons
How to Identify Unimodal vs Bimodal in Graphs
To identify the distribution:
- Look at the number of peaks in a histogram
- Count how many high-frequency points exist
- Check if data forms one cluster or two
This helps quickly determine the type of distribution.
Applications in Statistics and Data Analysis
Understanding unimodal and bimodal distributions is useful in:
- Data science
- Business analytics
- Market research
- Machine learning
It helps detect trends, patterns, and hidden insights.
Comparison Table
| Feature | Unimodal | Bimodal |
| Peaks | One | Two |
| Complexity | Simple | Moderate |
| Interpretation | Single trend | Two groups |
| Example | Test scores | Mixed population |
FAQs
What does unimodal mean?
Unimodal means a dataset has one peak or one most common value.
What does bimodal mean?
Bimodal means a dataset has two peaks, often showing two groups.
Can data have more than two peaks?
Yes, such data is called multimodal distribution.
Which is easier to analyze?
Unimodal data is usually easier to understand and analyze.
Why is bimodal important?
It helps identify hidden groups or patterns in data.
Conclusion
Understanding unimodal vs bimodal distributions makes data analysis clearer and more meaningful.
While unimodal data shows a single trend, bimodal data reveals multiple patterns within the same dataset.
Recognizing these differences helps you interpret information accurately and make better decisions in statistics and real-world applications.
Also Check These Posts
- Wild vs Stars Game Preview Head-to-Head Stats Key Players & Prediction in 2026
- Aura vs LifeLock | Features Pricing and Which Is Better for 2026

Sophia Miller
Hi, I’m Sophia Miller, a passionate language enthusiast and grammar lover. Ever since I was a child, I’ve been fascinated by the power of words and how proper grammar can transform communication. I’ve spent years exploring the intricacies of English, from punctuation quirks to sentence structures, and I love helping others master the art of writing clearly and confidently. Writing, teaching, and sharing tips has always been my way of connecting with fellow language lovers. When I’m not analyzing sentences, you’ll find me reading novels or sipping coffee while jotting down new ideas. Grammar isn’t just rules to me—it’s a way to express creativity with precision.
Books by Sophia Miller:
-
Mastering English Grammar Made Easy
-
The Writer’s Guide to Perfect Sentences